Arctic Amplification By Latitude
Arctic Amplification is the phenomenon where the Arctic is warming significantly faster than the global average. The causes include:
- The well known Arctic feedbacks related to the Arctic Death Spiral;
- The warming in the Arctic has weakened the Polar Vortex, which previously held cold air over Arctic and blocked out warm tropical air;
- The storms moving north from the tropics are arriving with more energy and can penetrate further into the Polar Vortex.
I'd never been able to find out how much the Arctic had warmed, until at 4m51s into Peter Wadham's TED Talk "A Farewell to Ice" he shows a remarkable plot of temperature increase by latitude. I couldn't find an attributed copy of the image anywhere, so I plotted it from the HadCRUT5 Analysis data:
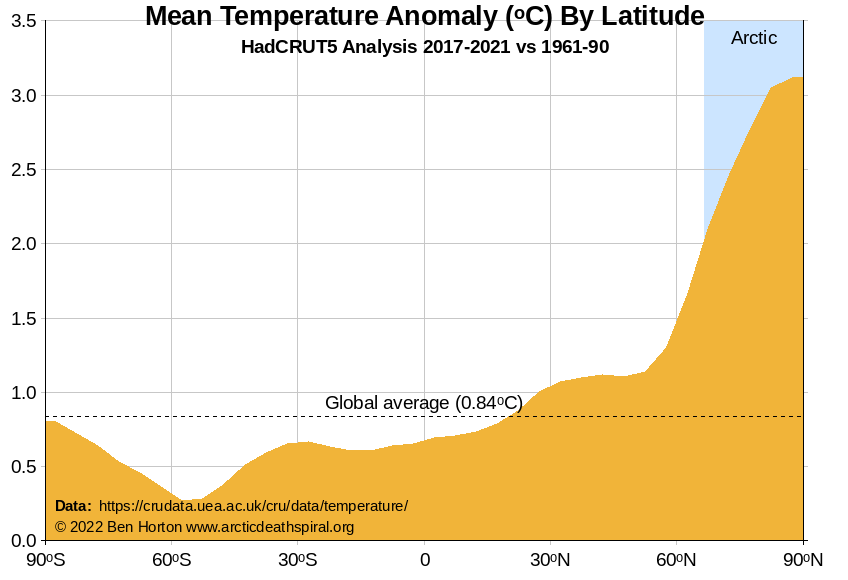
The temperature increase in the high Arctic is nearly four times greater than the global average!
Notes:
- The chart shows how the temperature averaged over the most recent 5 years at each latitude compares to the temperature at the same latitude averaged over the HadCRUT5 reference period 1961-90.
- The global average value is based on the same comparison and is calculated as an average across each 5° latitude band weighted by the surface area of that band, assuming the Earth is spherical.
- The global average shown here is lower than the increase reported since the pre-industrial (over 1°C) because the comparison is only with 1961-90 and temperatures had already risen a fraction of degree by 1961.
- The temperature has increased more in the northern hemisphere than the southern because temperatures have risen twice as much on land than the global average; and there's a lot more land in the northern hemisphere.
- I didn't use the HadCRUT5 data before 1961 because it contains latitudes with no temperature data points.
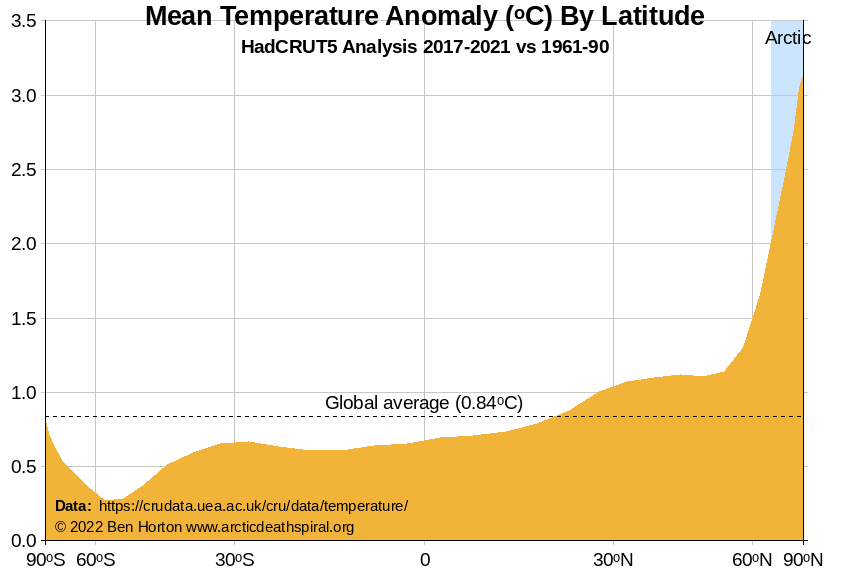
If you're wondering why there's a lot more amplification above the global average line than below it, it's because our planet's surface area per degree of latitude at polar latitudes is much smaller than at equatorial latitudes. For example 25% of the Earth's surface lies between 90°S and 30°S; 50% is between 30°S and 30°N; and 25% between 30°N and the North Pole.
I've re-plotted the chart above with latitude scaled by surface area:
Arctic Amplification Amplification
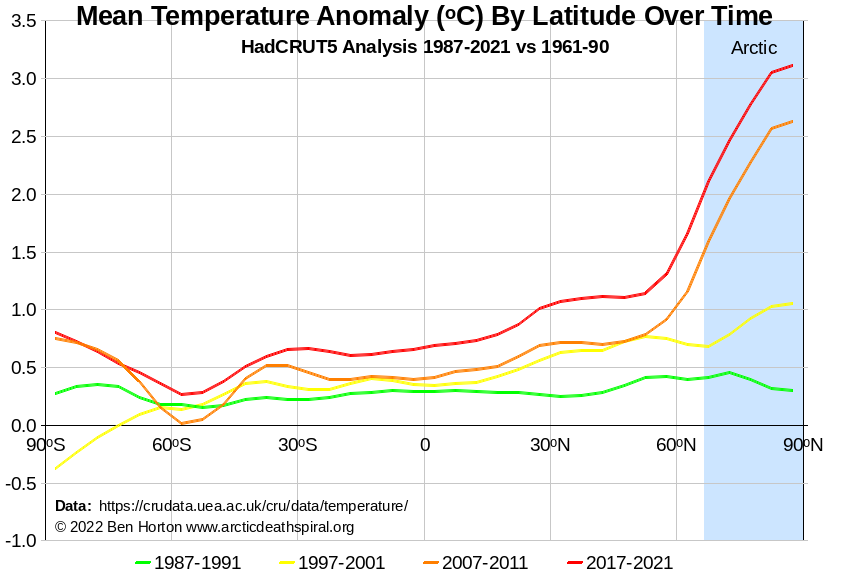
Arctic temperatures have been increasing far faster than the rest of the world consistently and progressively over the last few decades.
This chart shows the temperature change at each latitude averaged over four 5-year periods, and shows how it has increased globally and in the Arctic over recent decades:
Note:
- I've reverted to plotting latitude linearly to make different lines easier to distinguish.
- The global impacts of volcanic eruptions and El-Niños mean that temperature rises erratically over the years.
Arctic Amplification by Month
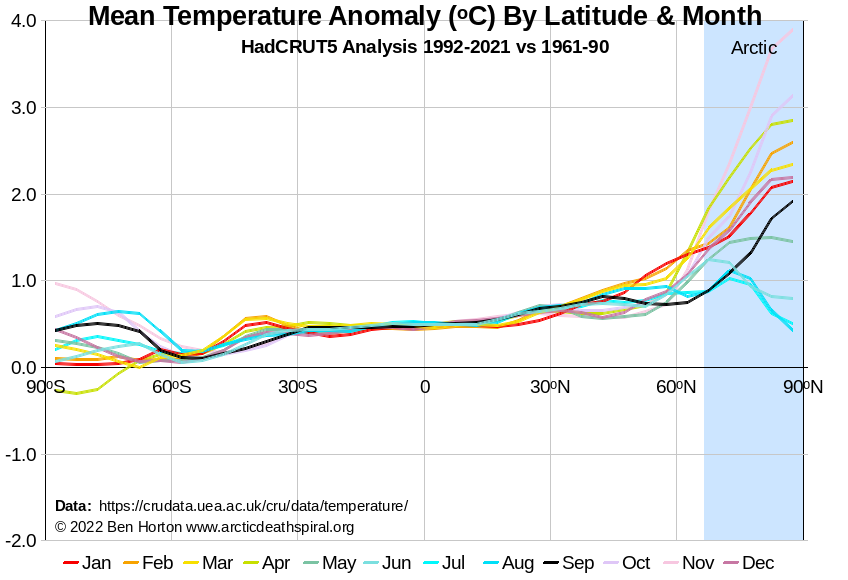
I was interested to know whether the Arctic has warmed more at one time of the year. So I plotted temperature increase averaged over the last 5 years for each latitude and month.
The answer is: yes, there is large variation between months. This charts shows that temperature increases in the Arctic are most extreme during the winter, with increases of around 5°C at the highest latitudes during October, November and February:

I couldn't understand why amplification was greater in October, November and February than in December and January. To reduce noise, I plotted again averaging over a longer sample period of 30 years. This is even more confusing with the greatest amplification in October, November, February and April:
The best explanation I have seen for the seasonal variation is that, comparing now and 50 years ago...
- As the ice melts in the summer, it holds the temperature at 0°C, now as it did 50 years ago, but with thinner ice now;
- During the winter, the ice is colder than 0°C but significantly less cold than it was 50 years ago, because it is far less thick than 50 years ago - see On Thin Arctic Sea Ice - and more heat reaches the air above from the sea below.
This suggests that Arctic Amplification will soon start to become significant during the summer months, as more significant areas of sea ice are lost - see Arctic Sea-Ice Area Loss.
Credits
Thank you to my friends Bradley Dean, Alex Zeffertt and Jonathan Shanklin for their help with this page.
Back to Arctic Death Spiral | About | Sitemap
Twitter: @ArcticDthSpiral | Instagram: @ArcticDeathSpiral